This is the multi-page printable view of this section. Click here to print.

Return to the regular view of this page.

Krkn Dashboard

Web-based UI to run Krkn chaos scenarios, review past runs and replay on the host, and optionally connect to Elasticsearch and Grafana.

Krkn Dashboard is the visualization and control component of krkn-hub. It provides a user-friendly web interface to run chaos experiments, watch runs in real time, and—when configured—inspect historical runs and metrics via Elasticsearch and Grafana. Instead of using the CLI or editing config files, you can trigger and monitor Krkn scenarios from your browser.


What is Krkn Dashboard?

Krkn Dashboard is a web application that sits on top of krkn-hub. The dashboard offers:

A graphical UI for visualizing runs

Select scenarios, set parameters, and start runs from the browser, no command line required. Ideal for demos and anyone who prefers an interactive interface.

Real-time visibility

See running chaos containers and stream logs as scenarios execute. Spot failures and deficiencies as they happen to locate and fix issues faster.

Saved configurations

Store and reuse scenario parameters in your browser. Recreate a test or standardize runs across your team without re-entering the same values.

Analyzing past runs

Connect to Elasticsearch to query and display past run details. Use Grafana to link to dashboards for a specific run.

Central space for collaboration

One place to view runs, share configurations, and collaborate with your team. See status, logs, and history in a single UI instead of scattered terminals or configs.


Features

Run chaos scenarios from the UI

You can run chaos scenarios from the Run Kraken page by choosing a scenario tile and filling in the form:

  1. Choose a scenario — e.g. pod-scenarios, container-scenarios, node-cpu-hog, node-io-hog, node-memory-hog, pvc-scenarios, node-scenarios, time-scenarios.
  2. Set parameters — Namespace, selectors, disruption counts, durations, and other scenario-specific options (the fields map to the environment variables used by krkn-hub).
  3. Provide cluster access — Upload a kubeconfig file for the run
  4. Start the run — The dashboard starts the corresponding krkn-hub container (via Podman/Docker). The Running Kraken containers table lists containers that are still running. When a run finishes, you can open Past Runs to see stored logs, outcomes, and replay options.

Save and Replay Runs

The Past Runs page lists chaos jobs that have completed on the machine where the dashboard server runs. Selecting a run shows metadata and captured logs.

You can save the current scenario and parameters and load them later. From Past Runs, you can open a finished job and use the Replay button to send the same scenario settings back to Run Kraken, adjust them if needed, and run the experiment again.

This history does not require Elasticsearch.

Elasticsearch runs

If you use Elasticsearch to store Krkn run data, open Elastic Runs and connect to your instance. After connecting, you can:

  • Query run details by date range and filters
  • View summary charts and graphs
  • See historical chaos runs and their metadata in the dashboard
  • Montitor alerts on the Alert Analysis tab

You can disconnect and reconnect to a different cluster or index when needed. Elasticsearch configuration is optional. The dashboard will still work without Elasticsearch for running jobs and using Past Runs on the host.

When Elasticsearch is connected and you supply an optional Grafana base URL at connect time, the dashboard can link each run to its corresponding metrics and visualizations in Grafana. Grafana configuration is optional.


Getting Started

Follow the installation steps to run the dashboard.
1 - Using the UI

How to run scenarios and use the dashboard once it is running.

Using the UI

Once the dashboard is running, open http://localhost:3000 (or the port shown in the terminal) in your browser. The side menu has three views: Run Kraken, Past Runs, and Elastic Runs. Each is described below.


Run Kraken

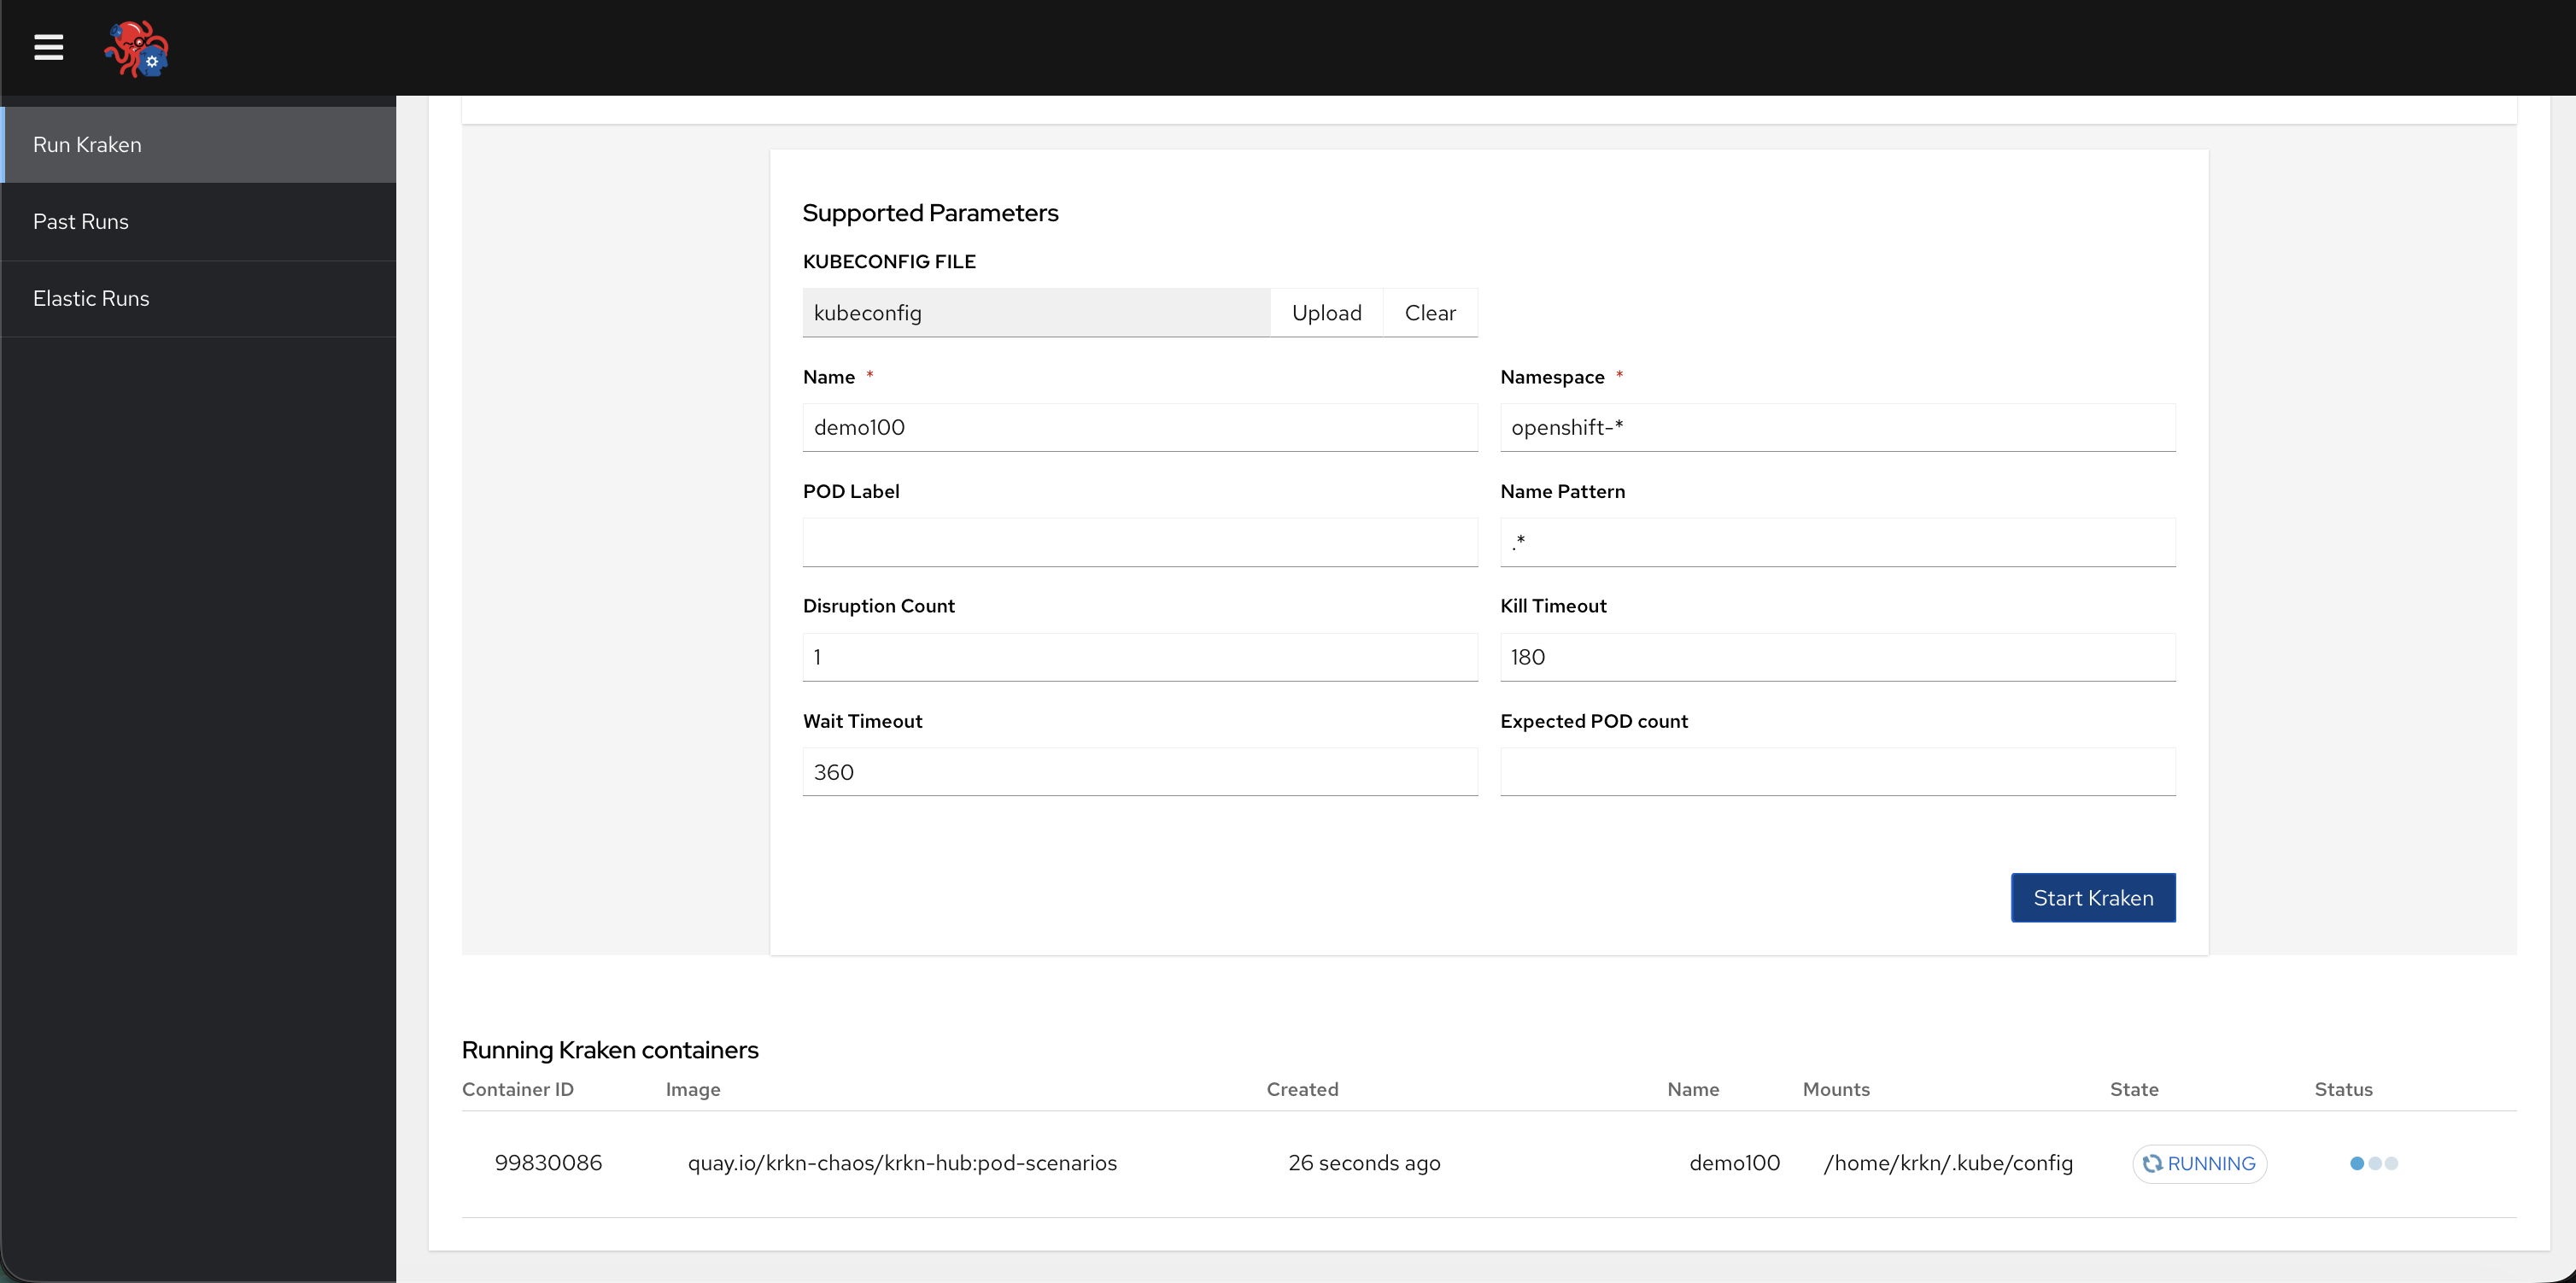
Run Kraken is the default landing page. Everything for starting a new chaos job is on this single page:

  • Scenarios — Scenario tiles (Pod Scenarios, Node CPU hog, Node IO hog, Node Memory hog). Click a tile to select that scenario for the next run.
  • Supported Parameters — Fields for the selected scenario, kubeconfig file upload, and Start Kraken to launch the krkn-hub container. If you arrived here by Replay, an inline notice shows the source run.
  • Running Kraken containers — A table of krkn-hub containers that are currently running on the host.

Run Kraken page


Past Runs

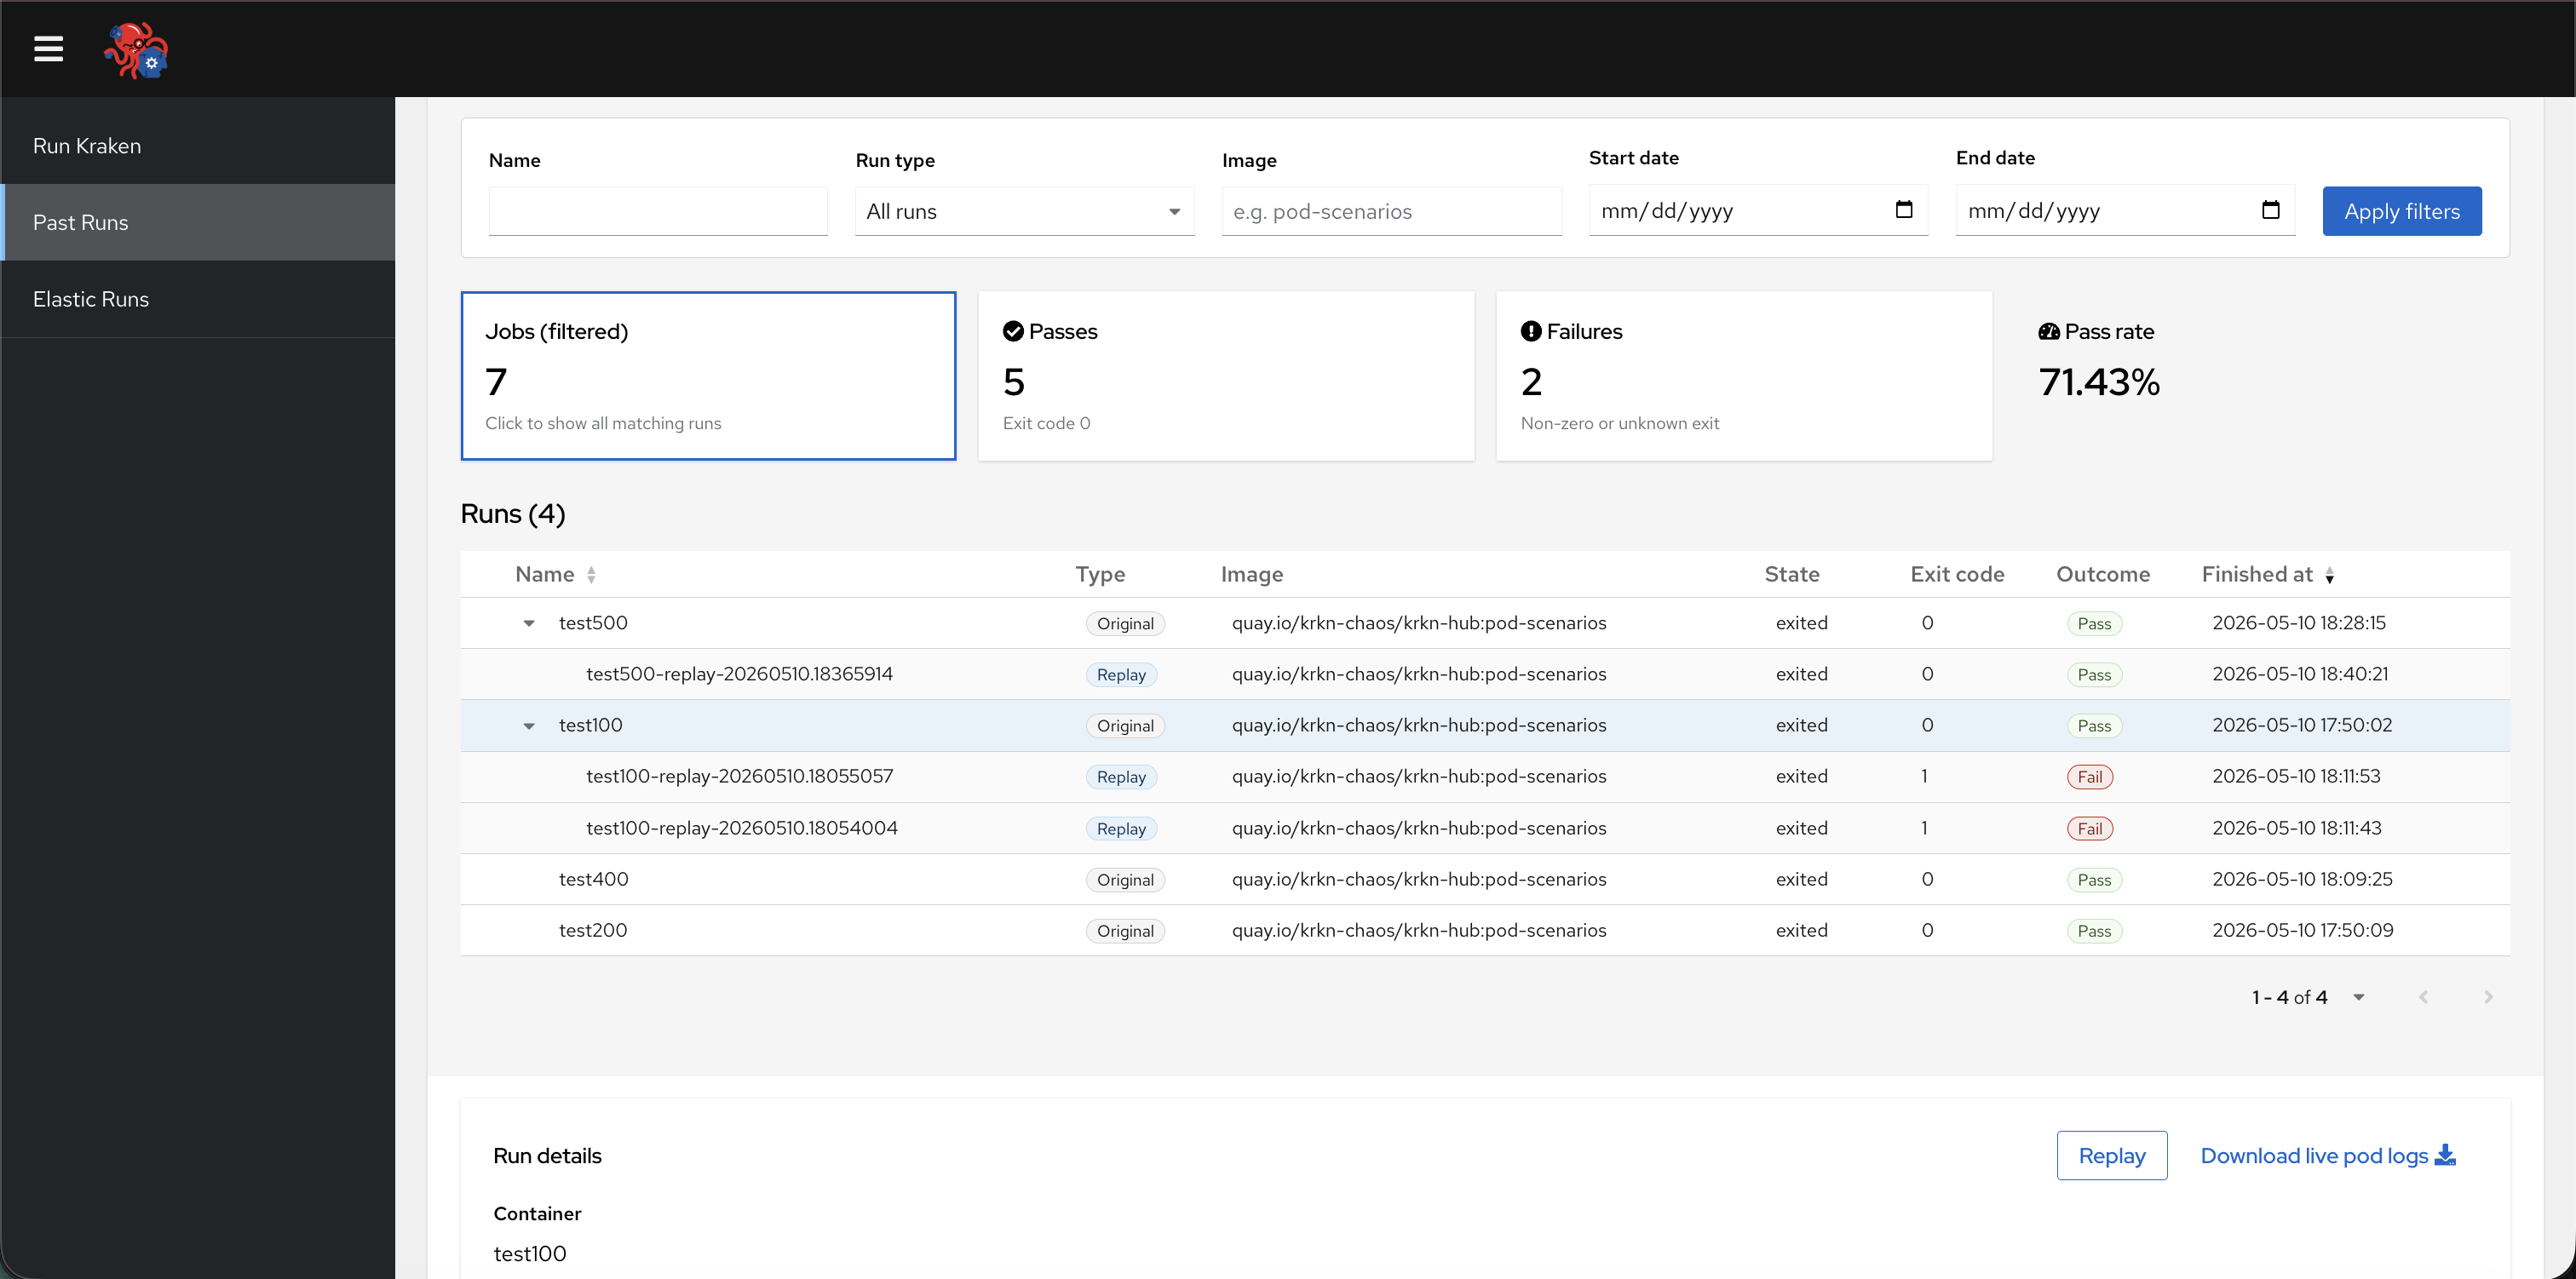
Past Runs lists jobs recorded by the dashboard.

  • Filters — Narrow by name, run type (all, original only, replay only), image substring, and start/end dates; use Apply filters and Refresh as needed.
  • Summary cards — Examine the job count, passes, failures, and pass rate.
  • Runs table — Sort by name or finished time. Expand or collapse rows that have replays to see nested replay entries. Select a row to open Run details and Logs. The Replay button pre-fills Run Kraken with the stored scenario parameters that were saved for that run.

Past Runs page


Elastic Runs

Elastic Runs is for Elasticsearch and Grafana, separate from Past Runs:

  • Not connected — A form titled Connect to Elastic Search asks for the ES instance URL, index name, optional username and password, and optional Grafana Base URL. Submit with Connect to the instance.
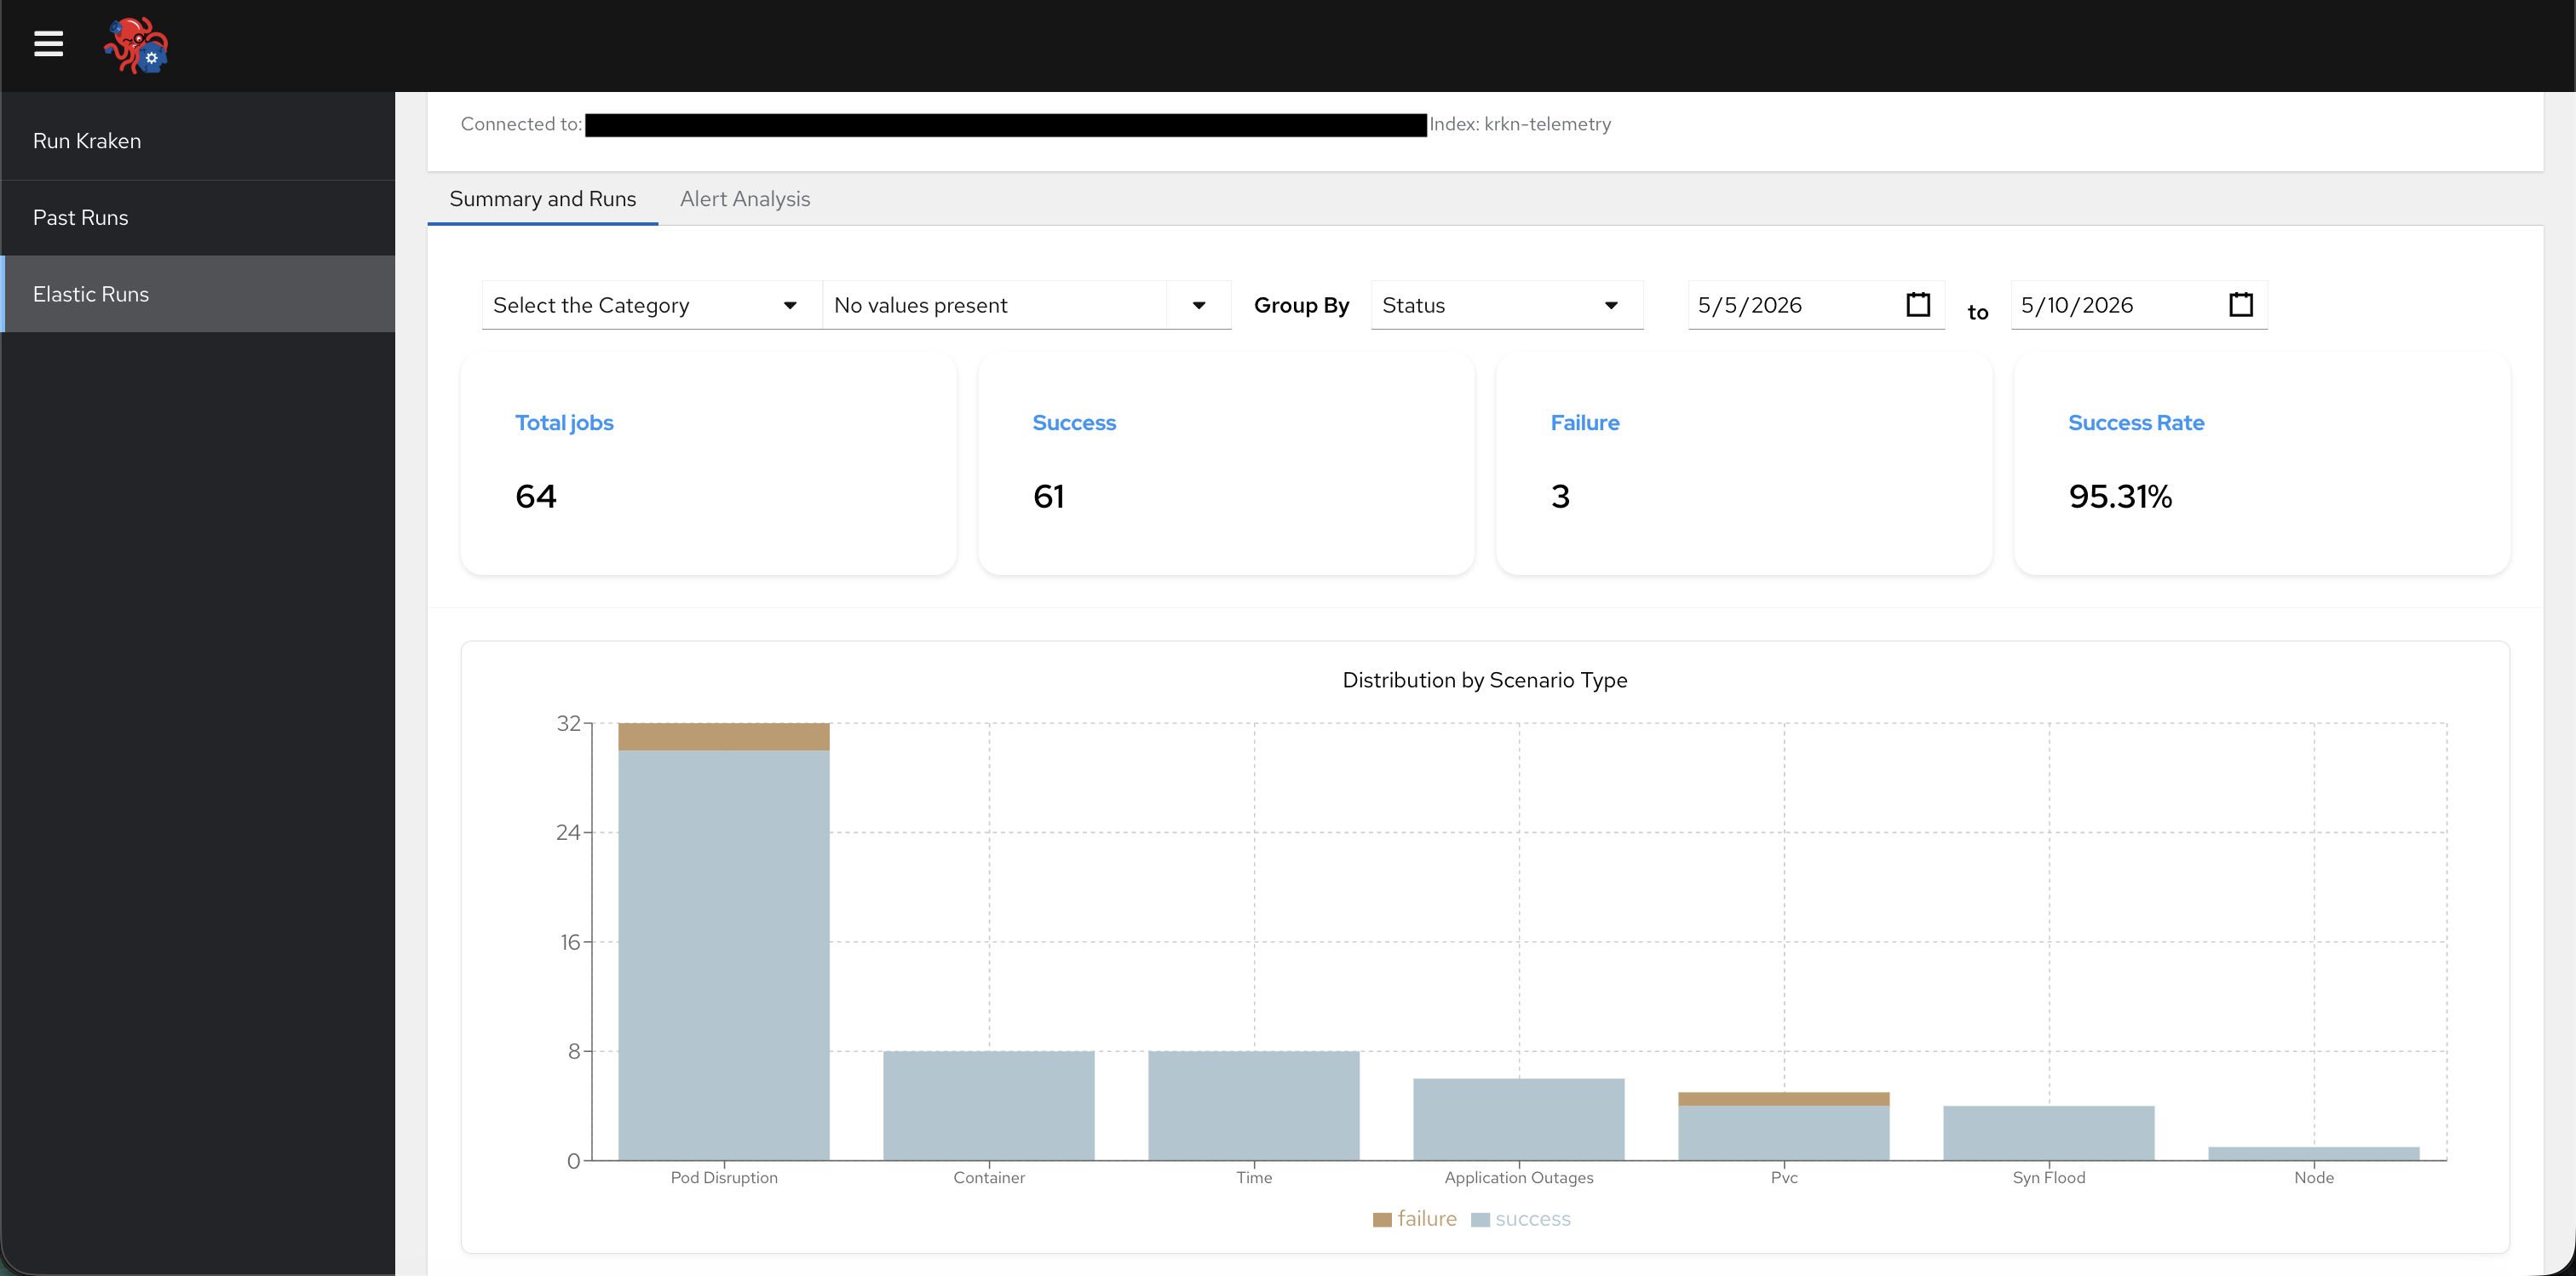
  • Connected — The header shows the host (and index); use Disconnect to return to the connect form. Two tabs appear:
    • Summary and Runs — Summary metric cards when aggregations are available, charts (summary or comparison layout depending on filters), and a Runs table of documents from Elasticsearch. Expand a row to see its configuration and graphs. If a Grafana base URL was set, a link will appear to open a Grafana dashboard with a breakdown of that scenario’s data.
    • Alert Analysis — A table of alerts when alert data is present.

Grafana opens pre-built dashboards for individual chaos runs; those links are produced through krkn visualize. Your grafana link may look something like “http://krkn-visualize-krkn-visualize . . . openshift.com/”.

Elastic Runs page