Using the UI
How to run scenarios and use the dashboard once it is running.
Using the UI
Once the dashboard is running, open http://localhost:3000 (or the port shown in the terminal) in your browser. The side menu has three views: Run Kraken, Past Runs, and Elastic Runs. Each is described below.
Run Kraken
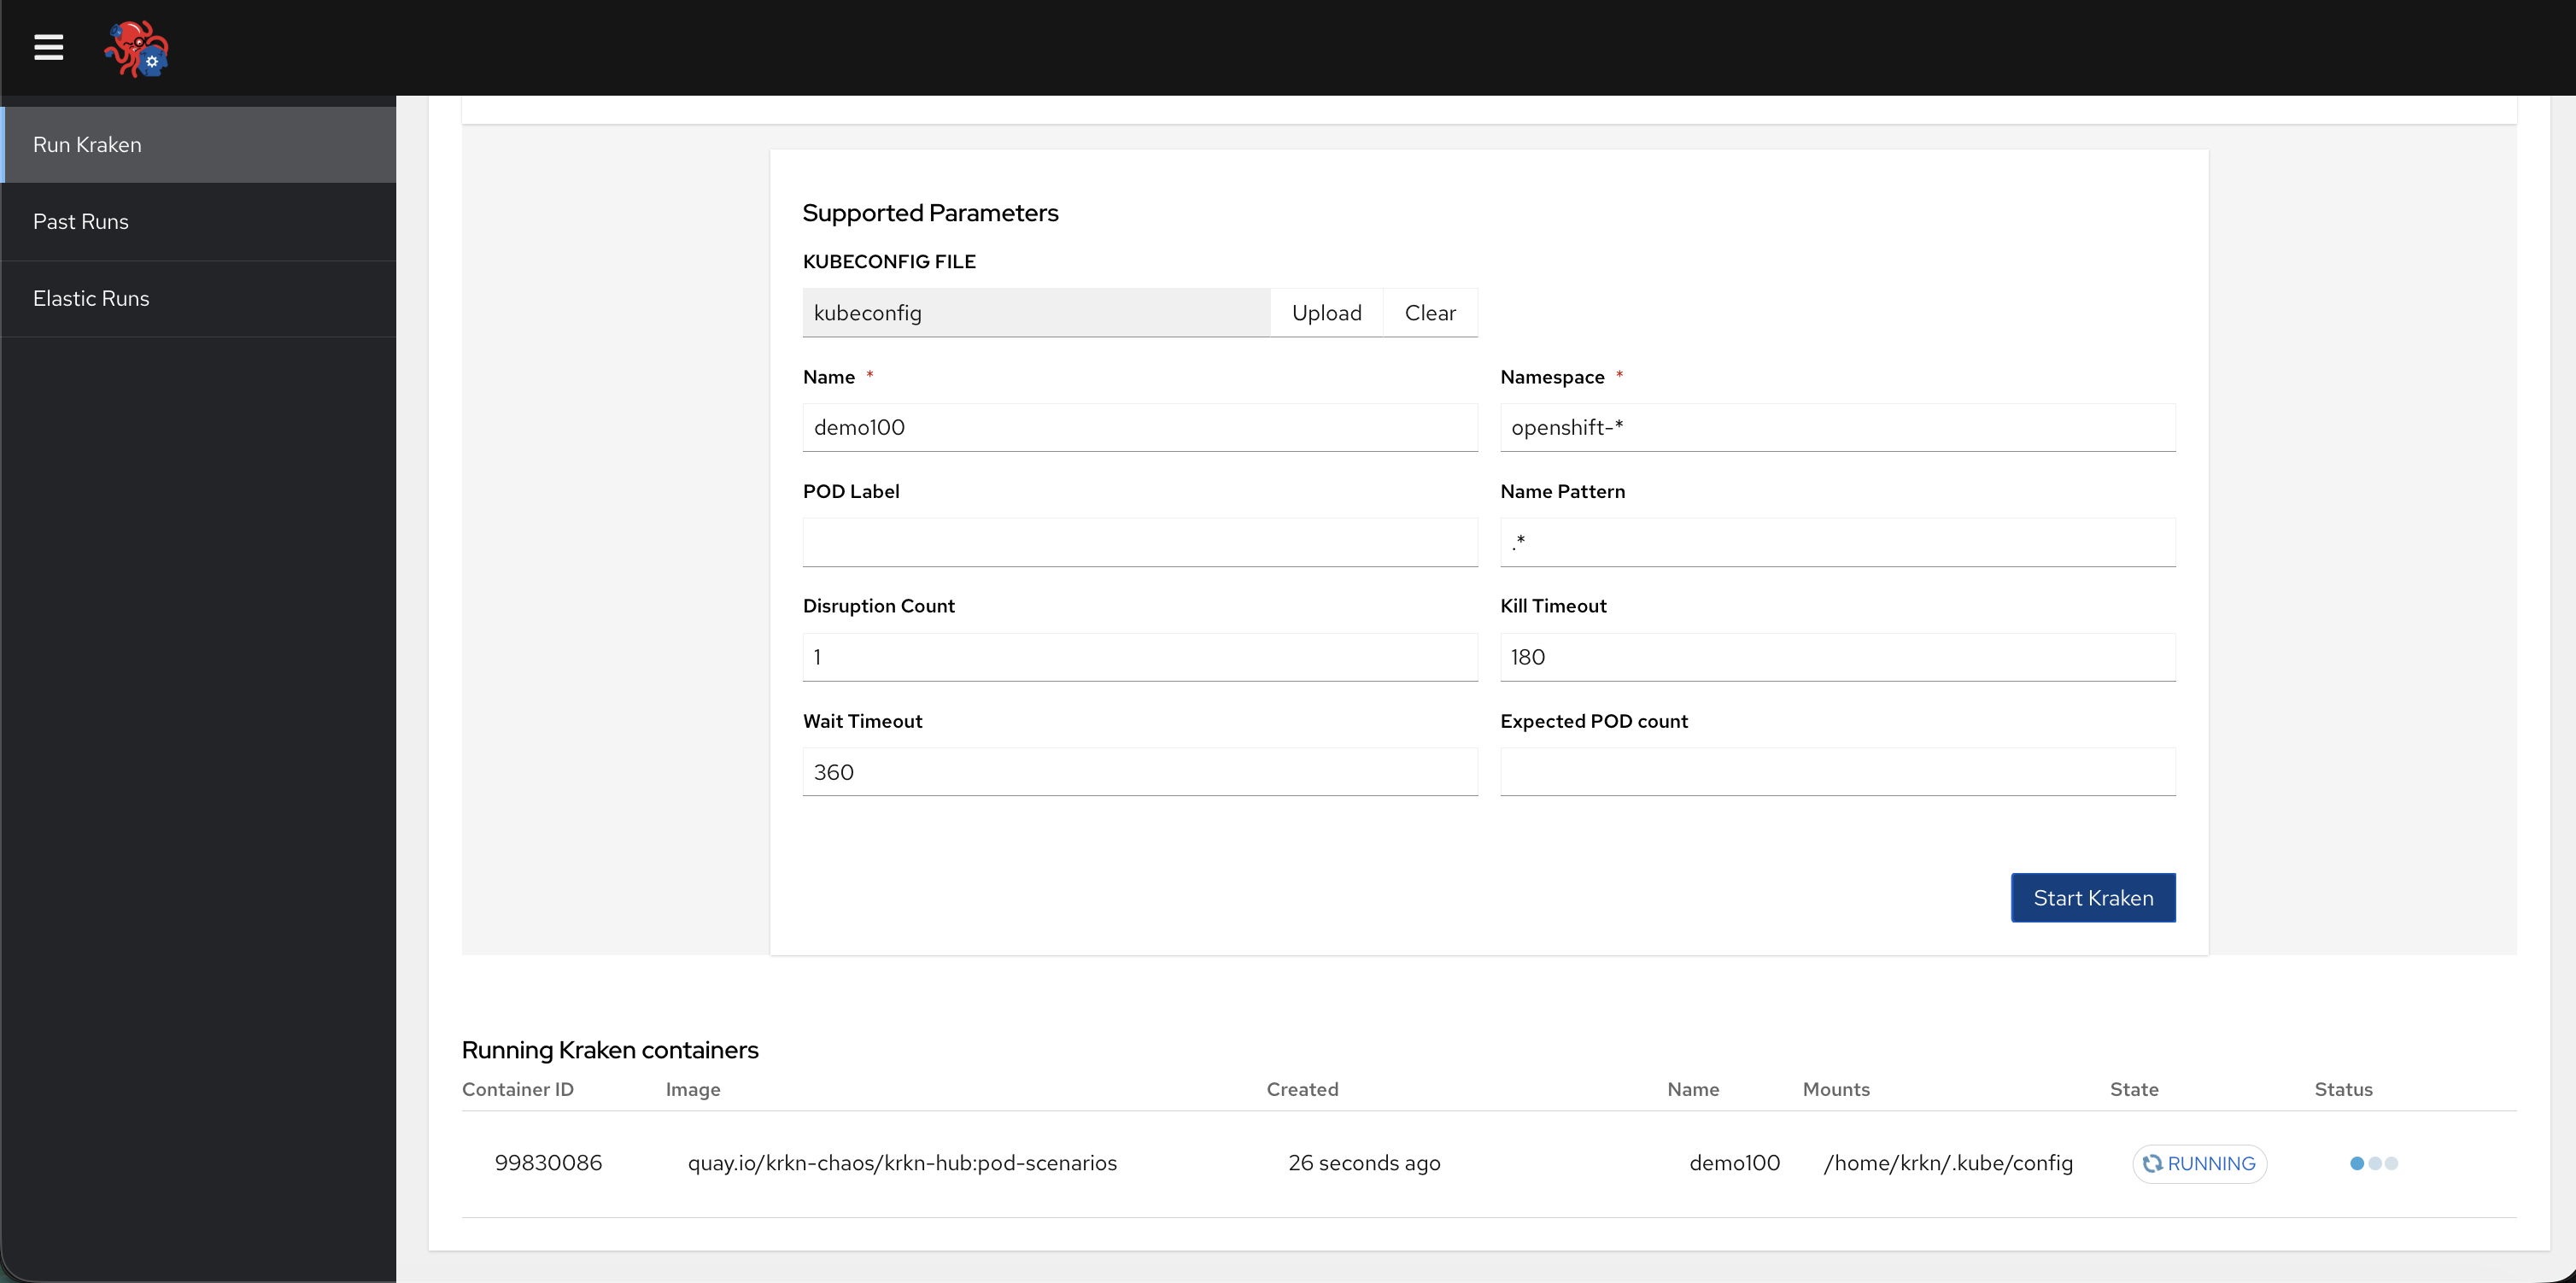
Run Kraken is the default landing page. Everything for starting a new chaos job is on this single page:
- Scenarios — Scenario tiles (Pod Scenarios, Node CPU hog, Node IO hog, Node Memory hog). Click a tile to select that scenario for the next run.
- Supported Parameters — Fields for the selected scenario, kubeconfig file upload, and Start Kraken to launch the krkn-hub container. If you arrived here by Replay, an inline notice shows the source run.
- Running Kraken containers — A table of krkn-hub containers that are currently running on the host.
Past Runs
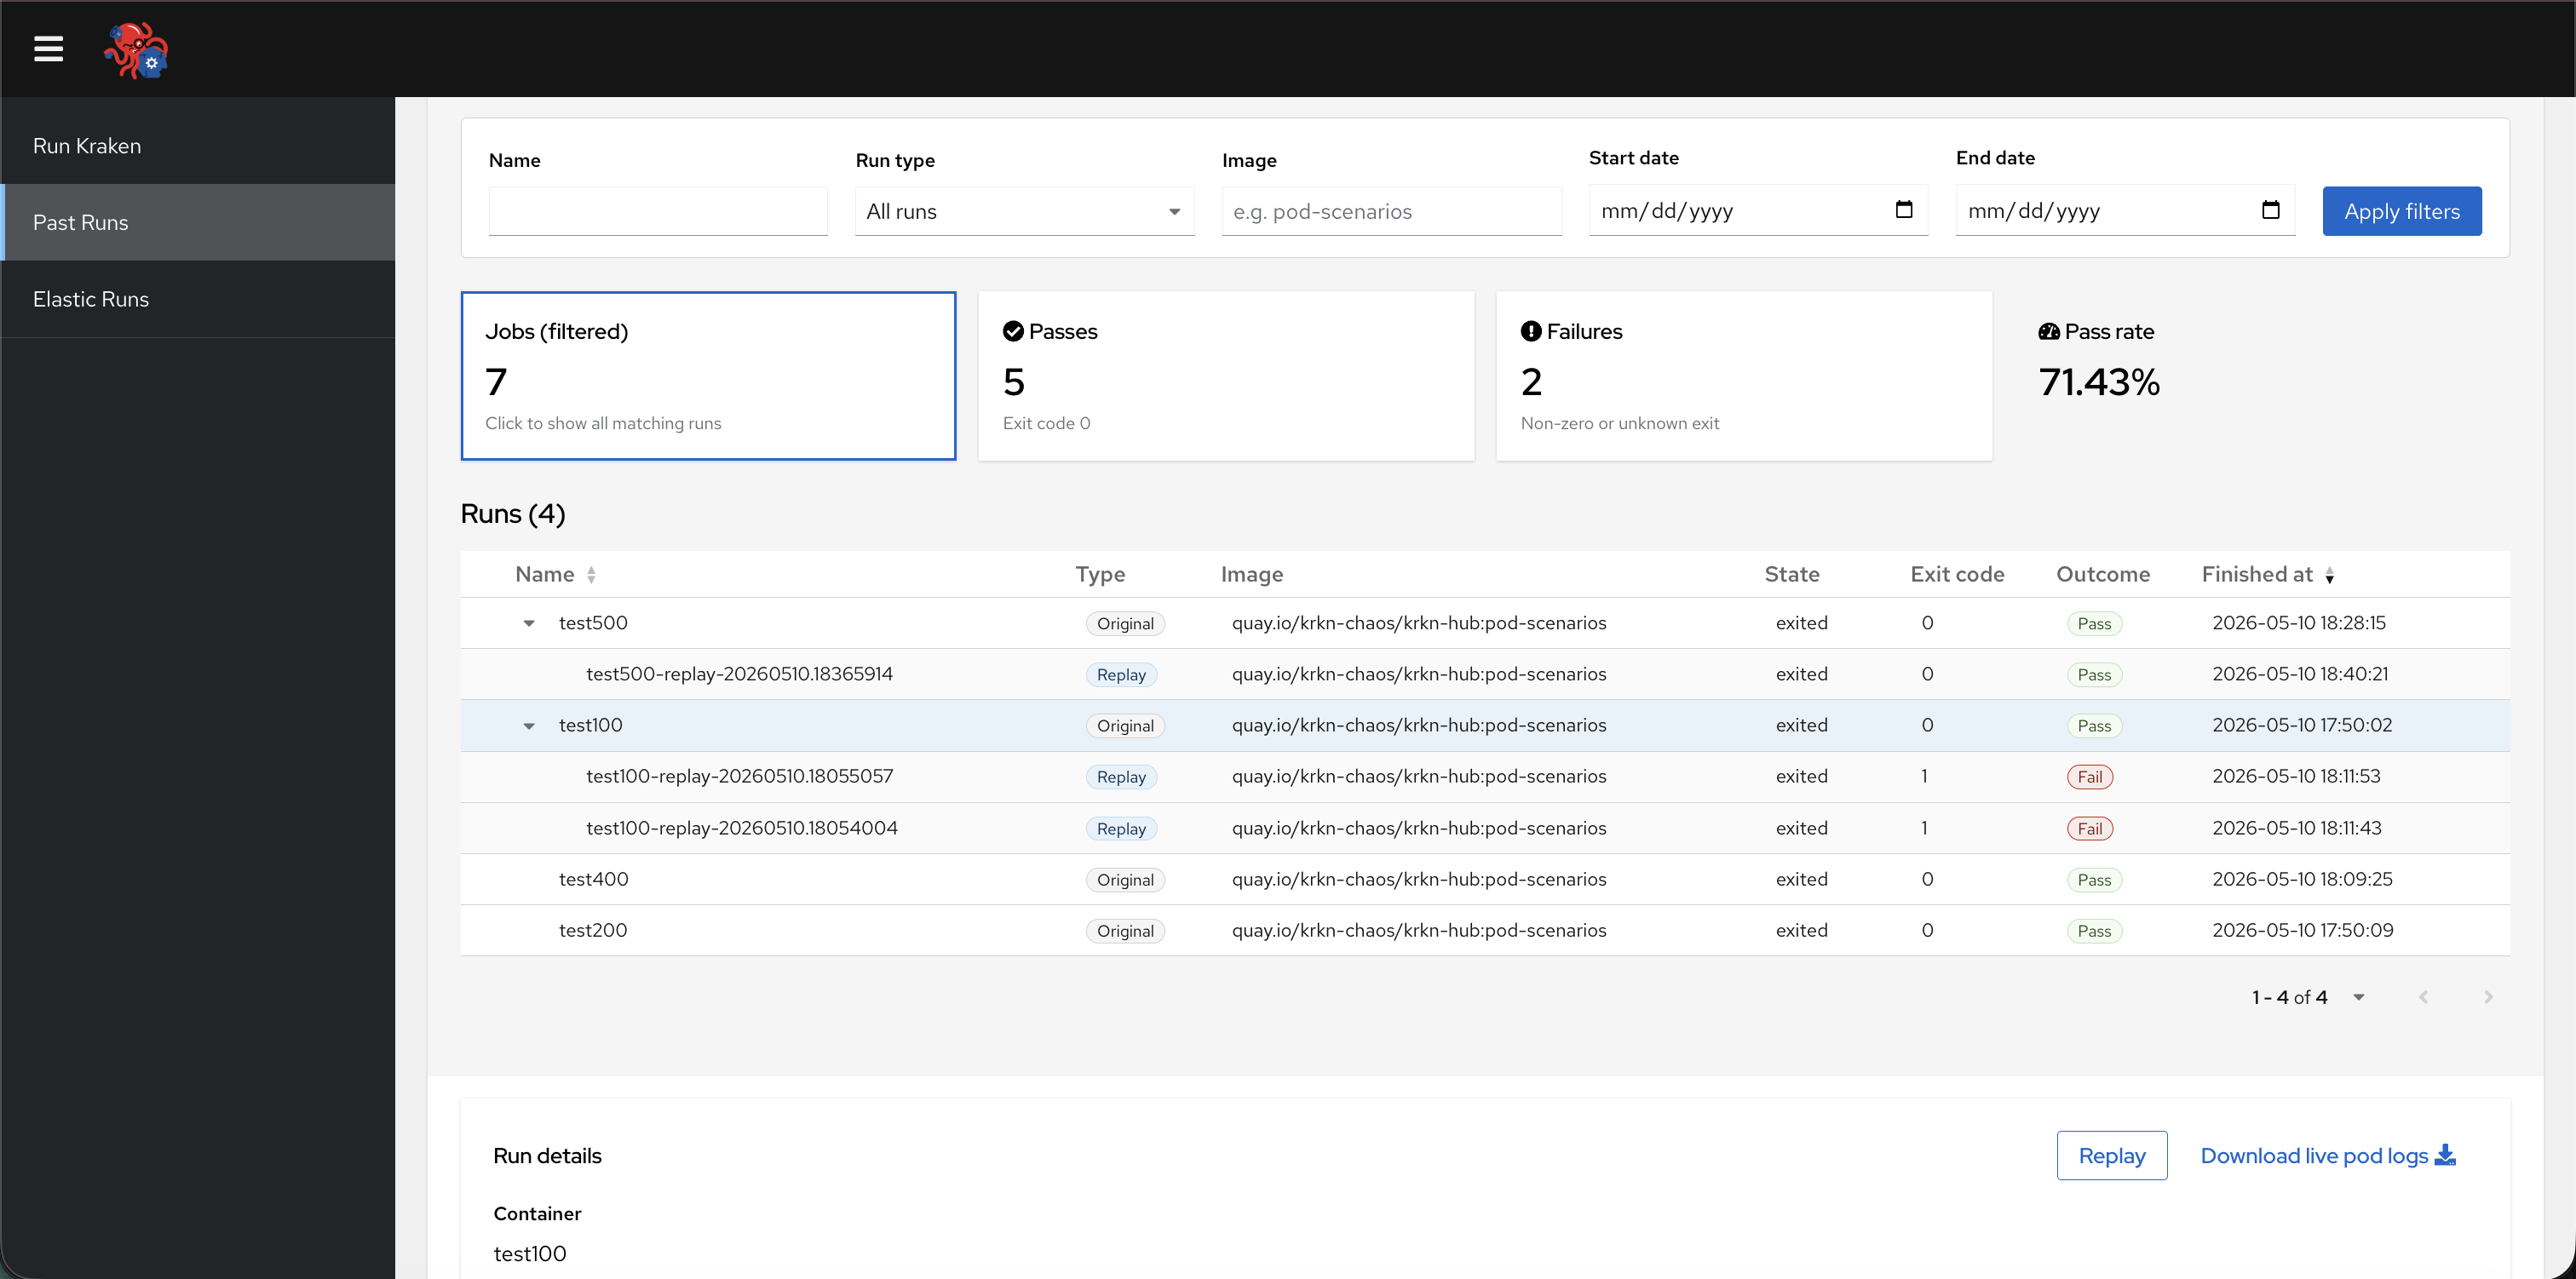
Past Runs lists jobs recorded by the dashboard.
- Filters — Narrow by name, run type (all, original only, replay only), image substring, and start/end dates; use Apply filters and Refresh as needed.
- Summary cards — Examine the job count, passes, failures, and pass rate.
- Runs table — Sort by name or finished time. Expand or collapse rows that have replays to see nested replay entries. Select a row to open Run details and Logs. The Replay button pre-fills Run Kraken with the stored scenario parameters that were saved for that run.
Elastic Runs
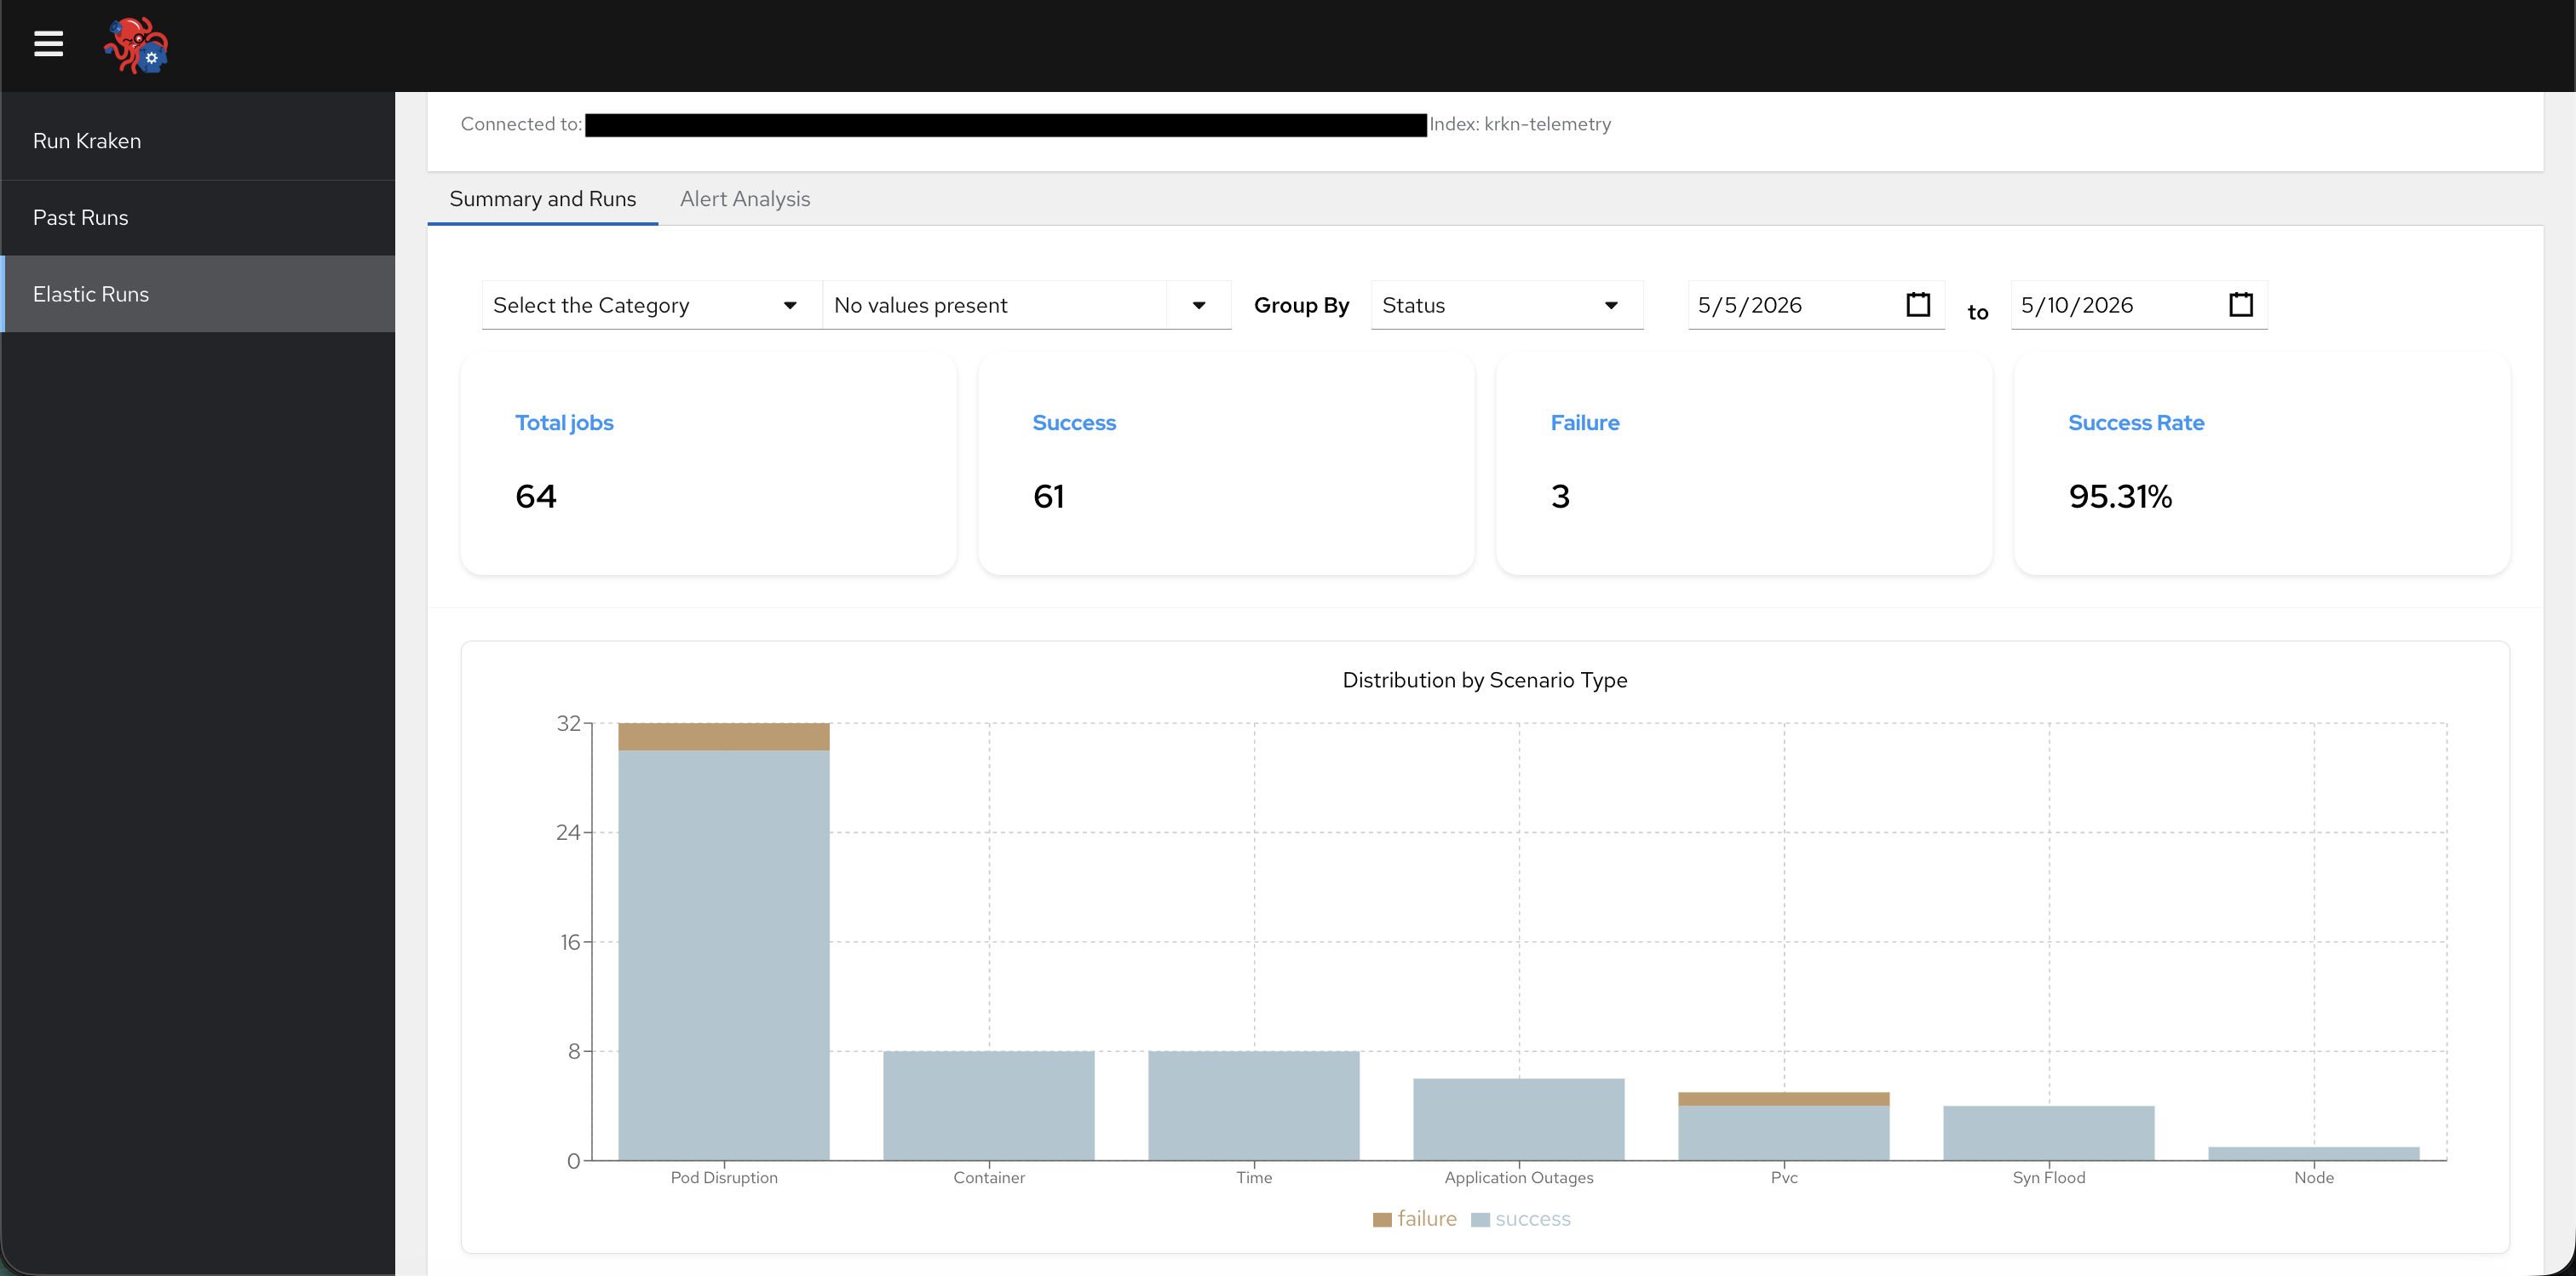
Elastic Runs is for Elasticsearch and Grafana, separate from Past Runs:
- Not connected — A form titled Connect to Elastic Search asks for the ES instance URL, index name, optional username and password, and optional Grafana Base URL. Submit with Connect to the instance.
- Connected — The header shows the host (and index); use Disconnect to return to the connect form. Two tabs appear:
- Summary and Runs — Summary metric cards when aggregations are available, charts (summary or comparison layout depending on filters), and a Runs table of documents from Elasticsearch. Expand a row to see its configuration and graphs. If a Grafana base URL was set, a link will appear to open a Grafana dashboard with a breakdown of that scenario’s data.
- Alert Analysis — A table of alerts when alert data is present.
Grafana opens pre-built dashboards for individual chaos runs; those links are produced through krkn visualize. Your grafana link may look something like “http://krkn-visualize-krkn-visualize . . . openshift.com/”.